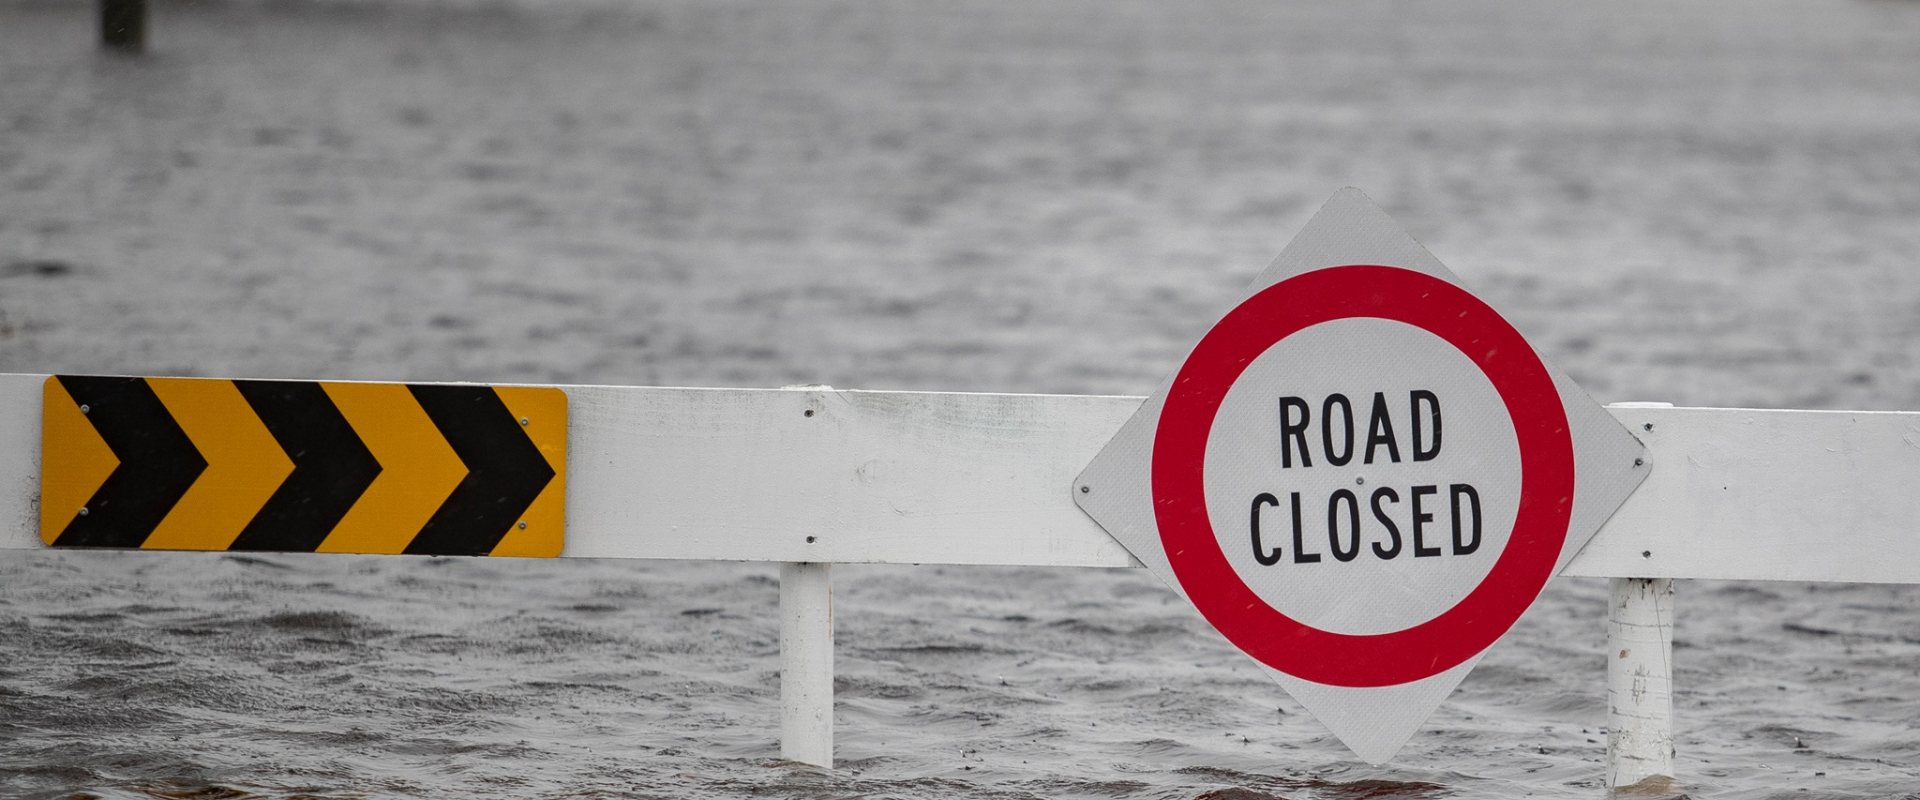
Advanced statistics aid Christchurch’s flood management
Consultancy firms GHD and HKV compiled a new flood risk analysis for the city of Christchurch, New Zealand. This new analysis helps the city to determine the goals of its future flood prevention plans and the required preventive measures.

Combined flood risk
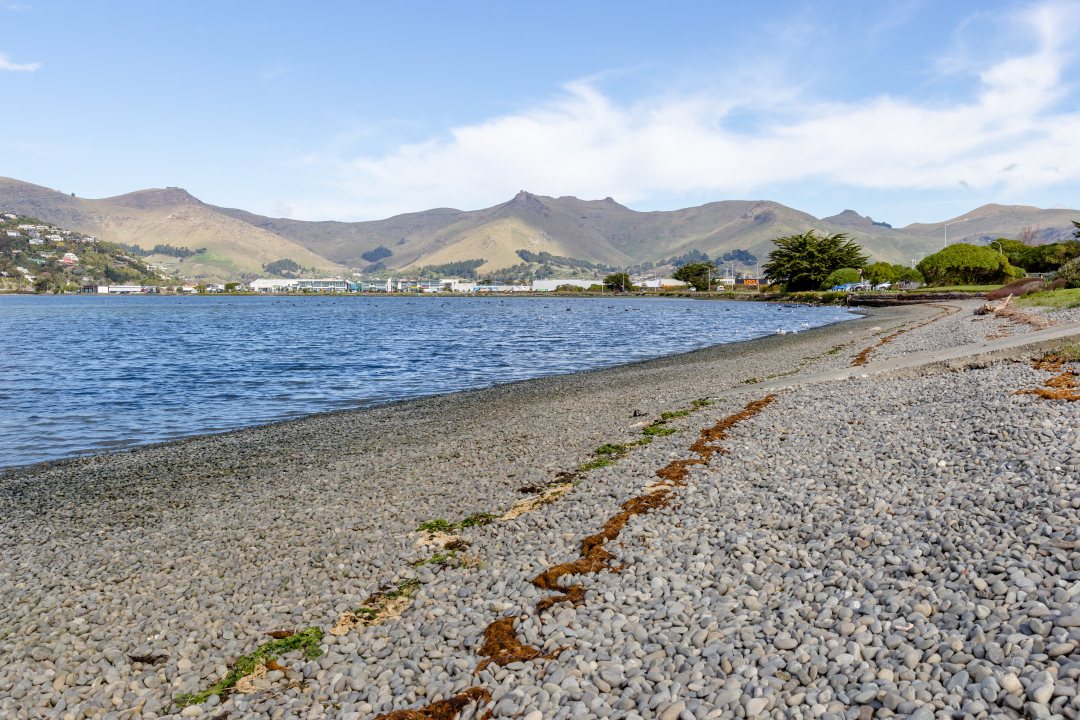
The Christchurch City Council was in need of a better understanding of the flood risk in tidal areas of the city, particularly the probability of high tides coinciding with significant rainfall events. The combined analysis provides the city insight in origin of extreme events, characterizes the recent historic relative sea level rise and quantifies the coincidence of extreme rainfall and surges. This allows the Christchurch City Council to make effective planning and management decisions within the city’s floodplains.

Higher water levels
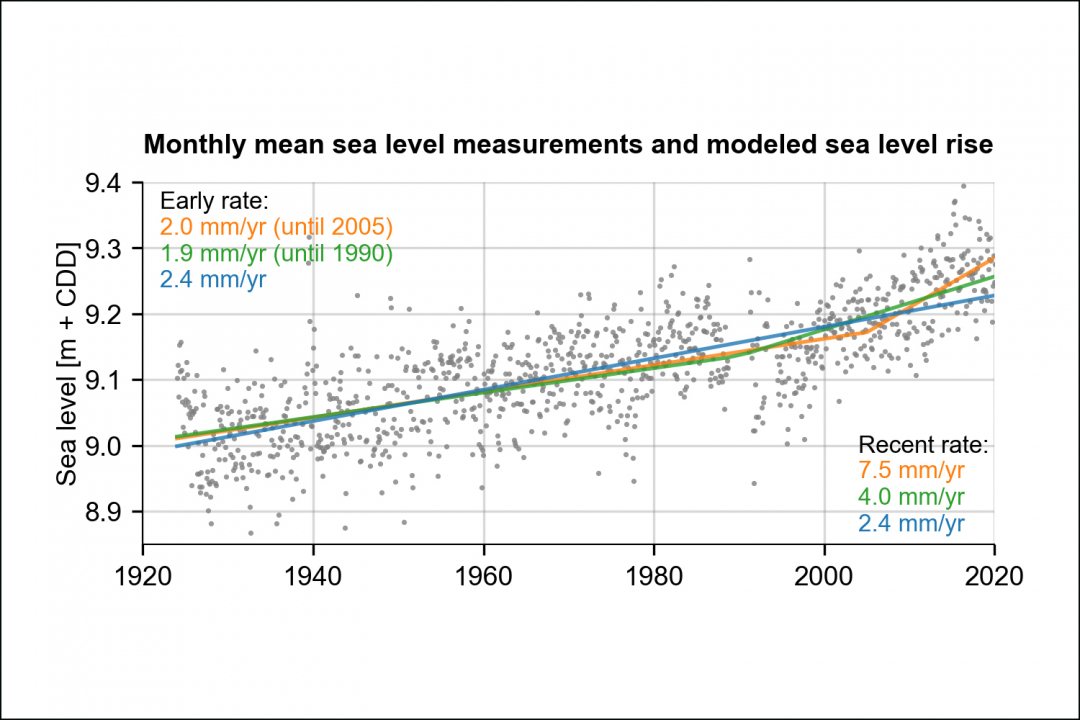
Compared to the last review of the high tide statistics in 2018, the new data shows slightly higher water levels for most locations. Additionally sea level rise proved to be substantially higher during recent decades, than the latest published trends show. The analysis showed sea level rise to be in the order of 4 mm/year and potentially up to 8 mm/year in recent years.
Christchurch uses the high tide statistics to inform the mapping of flood management areas in the Christchurch District Plan, design flood management infrastructure, setting floor levels for new buildings, planning for climate change adaptation and emergency management.

Importance of accuracy
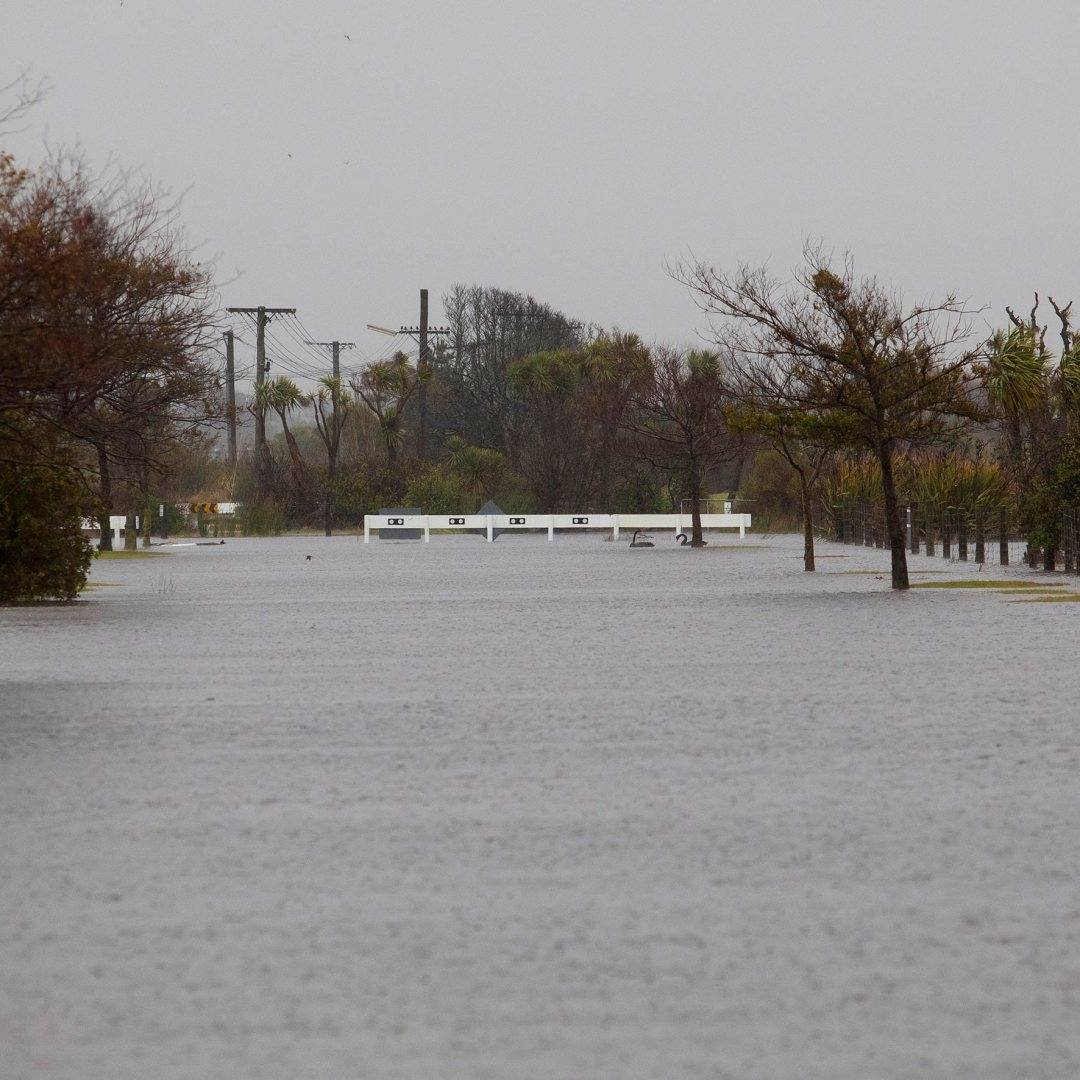
According to Helen Beaumont, Christchurch City Council head of Three Waters and Waste, the new statistics affect these notations. ‘Properties that are already close to a current flood management area might be considered to be at risk of a one-in-fifty-year flood as a result of the new information.‘
According to Gerbert Pleijter of Dutch flood risk expert company HKV the combined risk of a storm surge at sea and a heavy rain fall in the city, has never been mapped before. ‘Striking on the New Zealand situation is the required accuracy of the analysis. Differences of a few centimetres in predicted water levels can significantly affect the outcomes of flood risk analysis’, Pleijter notices and underpins the importance. ‘Used in future flood modelling, the new data will find its way in long term planning of infrastructure and affect decisions on billions of dollars of public and private investments.’
Statistic and probabilistic calculations
HKV and GHD selected a real event in March 2014 to validate the outcomes. This event had a once in 70-year rainfall and a once in 2-year high sea level. It was labelled as an outstanding historic event with a joint probability of 150-200 years.
Pleijter. ‘The statistic and probabilistic calculations matched the city’s flood models and have given the city increased confidence in their approach to climate resilience. This was an important confirmation for the city as the future of climate change causes many uncertainties.’
Average recurrence intervals
The analysis included the latest understanding of average recurrence intervals (ARI) in general. ‘In the Netherlands, we developed much knowledge of flood risk analysis, based on probabilistic calculations’, Pleijter adds.
Working with the local consultancy GHD in Christchurch, HKV was able to combine this generic knowledge with the local knowledge on sea level rise, weather events and the city's water system.’


